12. Translate Performance into Clinical Utility
Translate Performance into Clinical Utility
ND320 C2 L4 11 Translate Performance Statistics Into Clinical Utility Walkthrough Pt 1
ND320 C2 L4 12 Translate Performance Statistics Into Clinical Utility Walkthrough Pt 2
Summary
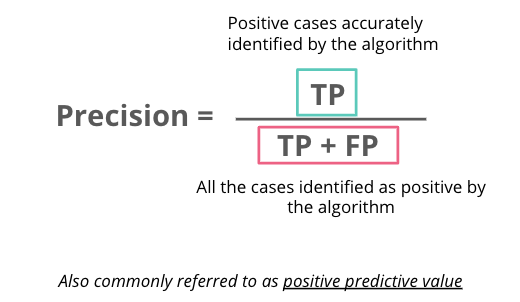
Precision
Precision looks at the number of positive cases accurately identified by an algorithm divided by all of the cases identified as positive by the algorithm no matter whether they are identified right or wrong. This metric is also commonly referred to as the positive predictive value.
Precision and recall
A high precision test gives you more confidence that a positive test result is actually positive since a high precision test has low false positive. This metric, however, does not take false negatives into account. So a high precision test could still miss a lot of positive cases. Because of this, high-precision tests don’t necessarily make for great stand-alone diagnostics but are beneficial when you want to confirm a suspected diagnosis.
When a high recall test returns a negative result, you can be confident that the result is truly negative since a high recall test has low false negatives. Recall does not take false positives into account though, so you may have high recall but are still labeling a lot of negative cases as positive. Because of this, high recall tests are good for things like screening studies, where you want to make sure someone doesn’t have a disease or worklist prioritization where you want to make sure that people without the disease are being de-prioritized.
Optimizing one of these metrics usually comes at the expense of sacrificing the other.
Threshold
CNN models output a probability ranging from 0-1 that indicates how likely the image belongs to a class. We will need a cut-off value called threshold to assist in making the decision if the probability is high enough to belong to one class. Recall and precision vary when a different threshold is chosen.
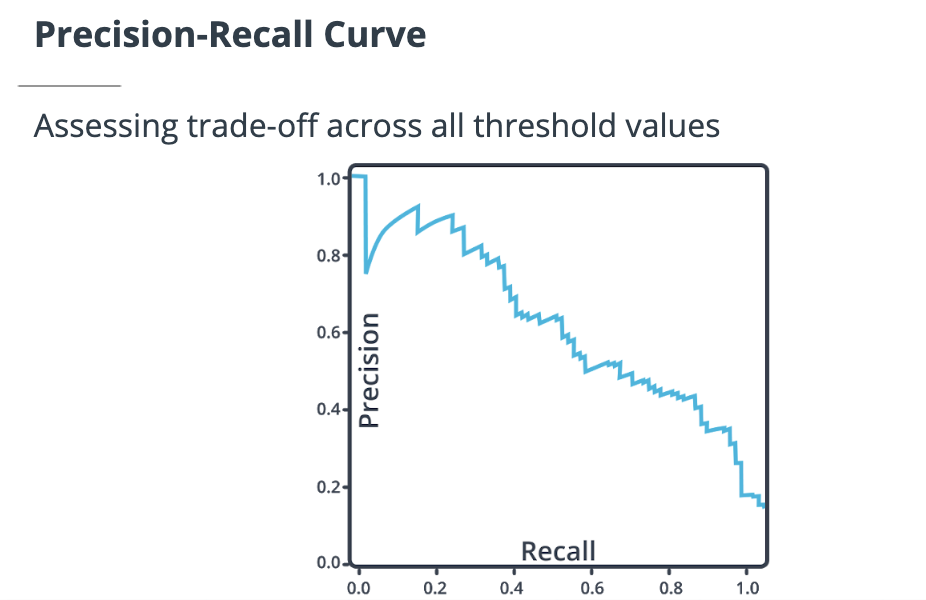
Precision-recall curve
Precision-recall curve plots recall in the x-axis and precision in the y-axis. Each point along the curve represents precision and recall under a different threshold value.
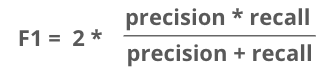
F1 score
For binary classification problems, the F1 score combines both precision and recall. F1 score allows us to better measure a test’s accuracy when there are class imbalances. Mathematically, it is the harmonic mean of precision and recall.